强直性脊柱炎治疗的“关键线索”:I型干扰素信号与AIF-1揭开TNFi耐药面纱
强直性脊柱炎(AS)作为一种以脊柱附着点炎症和骨融合为特征的慢性炎症性关节炎,其治疗长期依赖肿瘤坏死因子抑制剂(TNFi)。然而,临床中 30%-40% 的 AS 患者对 TNFi 治疗无响应,且现有炎症标志物(如 CRP)和临床特征(如年龄、病程)对治疗响应的预测价值有限,未能实现精准分层治疗。阐明 TNFi 耐药的免疫学机制并筛选可靠预测生物标志物,成为改善 AS 治疗结局的关键问题。
2025 年 7 月,来自韩国先进科学技术研究院(KAIST)、首尔国立大学医学院等机构的研究团队在《Nature Communications》杂志发表研究论文 “Type 1 interferon signature and allograft inflammatory factor-1 contribute to refractoriness to TNF inhibition in ankylosing spondylitis”。该研究揭示了强直性脊柱炎(AS)患者对肿瘤坏死因子抑制剂(TNFi)治疗耐药的关键机制,并发现了可预测治疗反应的生物标志物。
该研究围绕 TNFi 治疗响应差异的核心问题,采用纵向多组学联合单细胞解析策略。研究纳入接受 TNFi 治疗的 AS 患者队列(含 1 个发现队列和 3 个验证队列),通过单细胞 RNA 测序对治疗前后的外周血单核细胞(PBMCs)进行免疫景观分析,结合 UMAP 聚类、Milo 差异丰度分析等生物信息学方法,解析应答者与非应答者的细胞亚群和转录组差异。同时,通过体外细胞实验(AIF-1 刺激、siRNA 敲除)验证关键分子功能,并利用 ELISA、qRT-PCR 等技术在多队列中验证生物标志物效能。
研究发现,非应答者基线时即存在显著升高的 I 型干扰素(IFN)信号,该信号与 TNFi 治疗后反常增强的 IFN 应答和 Th17 细胞反应密切相关。进一步分析鉴定出同种异体移植炎症因子 - 1(AIF-1)为核心生物标志物:非应答者基线血清 AIF-1 水平显著升高,且与 I 型 IFN 信号强度正相关,以 63.5 pg/ml 为临界值时,预测非响应的敏感性达 89.5%、特异性 82.1%。机制上,AIF-1 通过上调 IFNα 受体表达和促进 IL-1β、IL-6 等细胞因子分泌,增强 Th17 细胞分化,形成炎症放大循环。单细胞分析显示,非应答者基线 CXCL10⁺经典单核细胞和 ISG⁺非经典单核细胞比例更高,TNFi 治疗后这些亚群的炎症特征进一步强化。
当前 AS 研究多聚焦 TNF 通路调控,对治疗耐药的免疫异质性解析不足,且缺乏稳定可靠的预测标志物。该研究首次揭示 I 型 IFN 信号和 AIF-1 在 TNFi 耐药中的核心作用,通过单细胞技术精准定位关键单核细胞亚群,结合多队列验证确立 AIF-1 的临床预测价值,为 AS 的个性化治疗提供了从机制到应用的完整证据链,填补了现有生物标志物临床转化的空白。
产品编号:RPC288Hu01
产品名称:离子化钙结合适配分子1(AIF1)重组蛋白

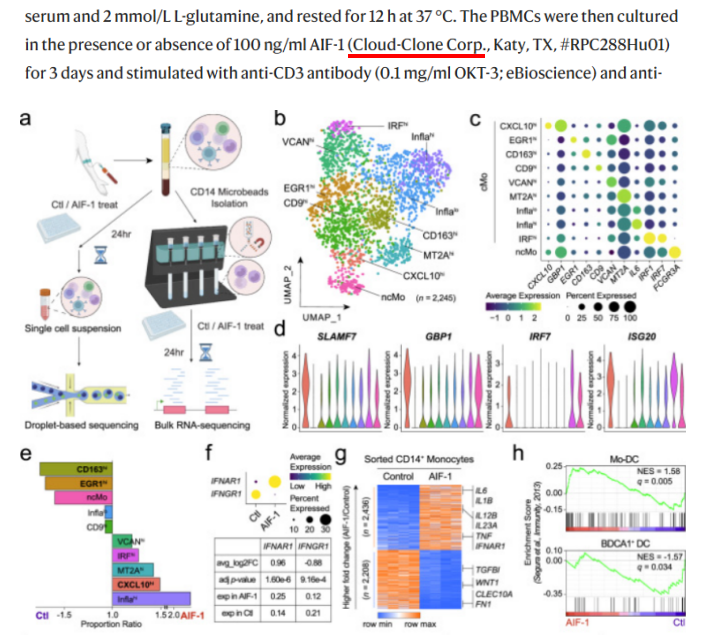
a Schematic of the experimental design. PBMCs from healthy donors (n = 4) were treated with AIF-1 or control (Ctl) and subjected to scRNA-seq. In addition, CD14+ monocytes were isolated from PBMCs using CD14 Microbeads and treated with AIF-1 or Ctl, followed by bulk RNA sequencing. Created in BioRender. https://BioRender.com/q70l192. b UMAP of monocytes from AIF-1-treated PBMCs, revealing 10 clusters (n = 2245). c Dot plot showing the average expression of key markers in each cluster from AIF-1-treated UMAP. d Violin plot of log-normalized expression values for SLAMF7, GBP1, IRF7, and ISG20. e Bar plots showing the proportion of each cluster in AIF-1-treated versus Ctl PBMCs, represented as the AIF-1/Ctl ratio. f Dot plot comparing the expression of IFNAR1 and IFNGR1 between AIF-1 treated monocytes and control monocytes. The accompanying table summarizes the average log2 fold change (avg_log2FC), Bonferroni-adjusted p-value (adj p-value), and expression levels (exp) in AIF-1 treated versus control cells. (Wilcoxon rank sum test, two-sided). g Heatmap showing the expression of inflammatory cytokines (e.g., IL1B, IL6, IL-23) in monocytes treated with AIF-1 versus Ctl as determined by bulk RNA sequencing. h GSEA plot of DEGs from bulk RNA-seq, highlighting monocyte-derived dendritic cells (Mo-DCs) and BDCA1+ DC markers